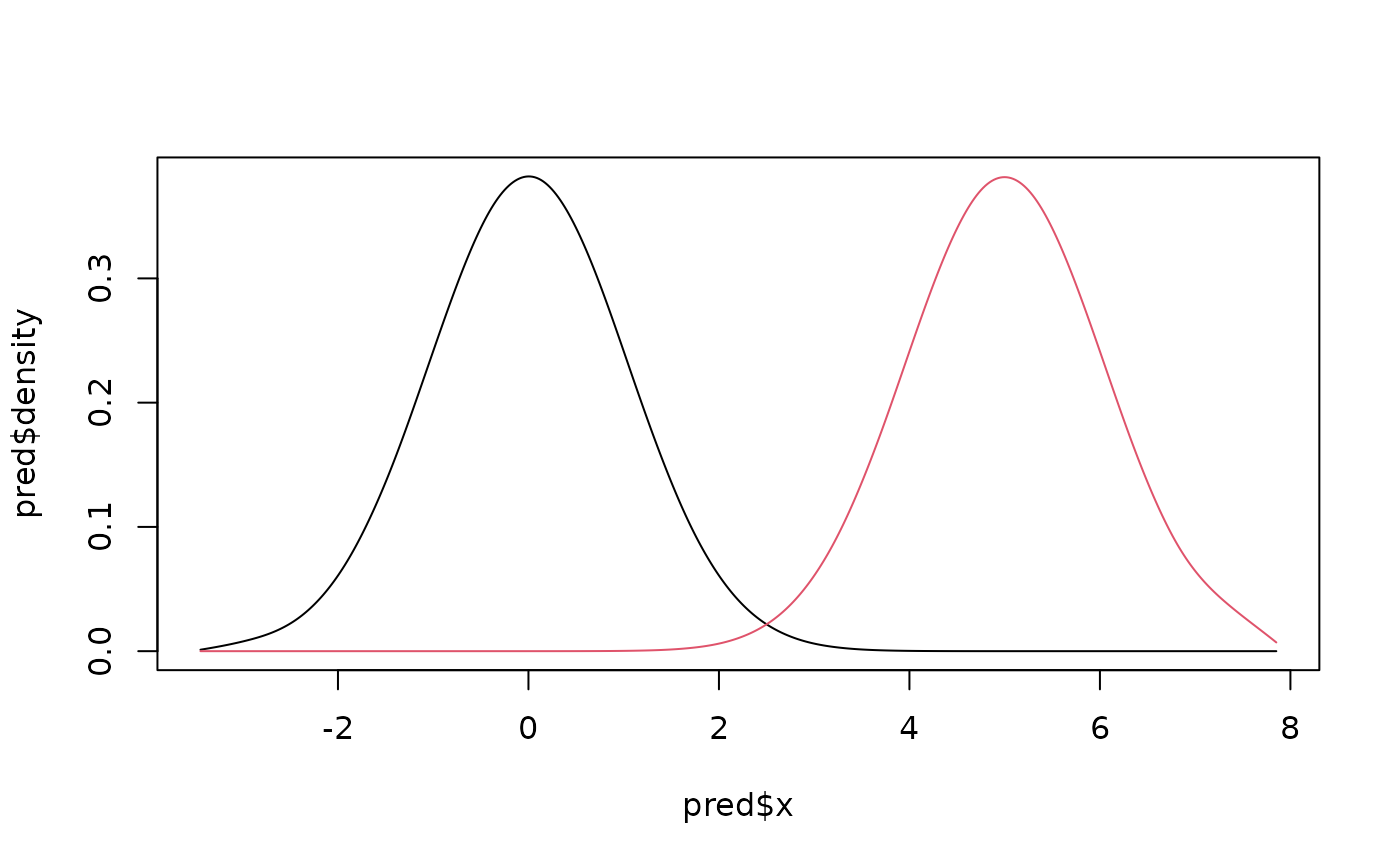
Evaluates the smooth densities built with smoothdens for given spline coefficients, e.g. to plot the estimated state-dependent densities.
Usage
# S3 method for class 'smoothdens'
predict(object, coef, x = NULL, ...)
Arguments
- object
object of class "smoothdens" for one data stream
- coef
coefficient matrix, one row per state, without the last column fixed at zero
- x
optional points to evaluate the densities at, defaults to the prediction grid object$xseq
- ...
unused
Value
list with the points x and the matrix density of densities, one row per point and one column per state
Examples
x = c(rnorm(100, 0, 1), rnorm(100, 5, 1))
dens = smoothdens(x, par = list(mean = c(0, 5), sd = c(1, 1)))
# densities at the initial coefficients
pred = predict(dens, coef = dens$coef)
matplot(pred$x, pred$density, type = "l", lty = 1)